Hey all, updating the graphs again.
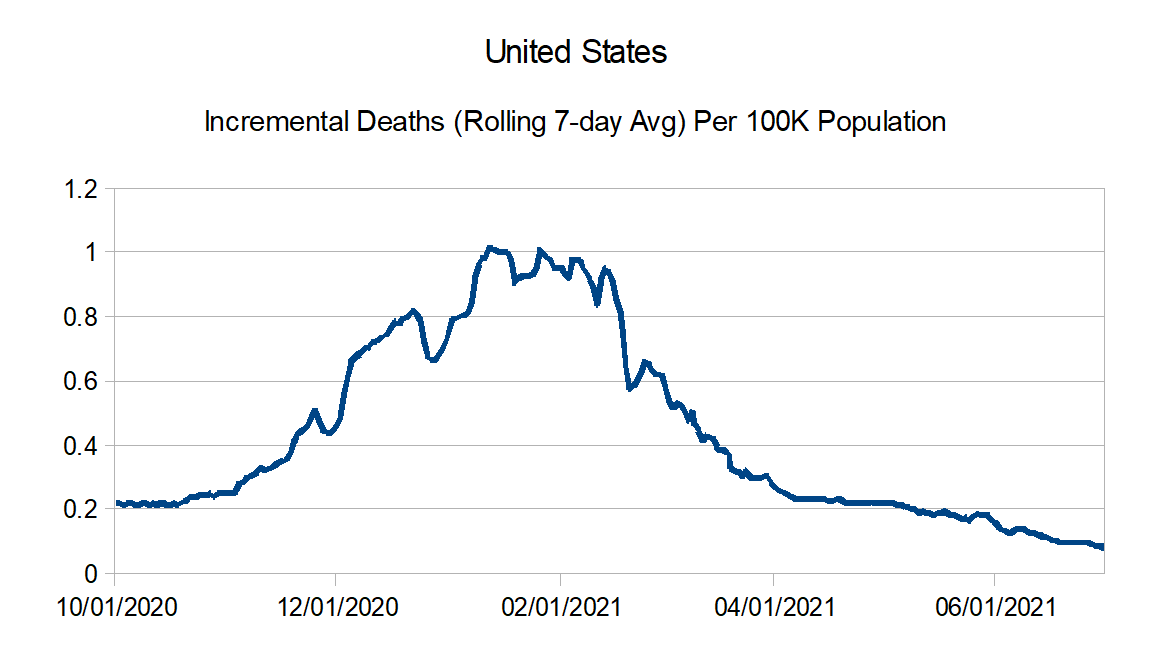
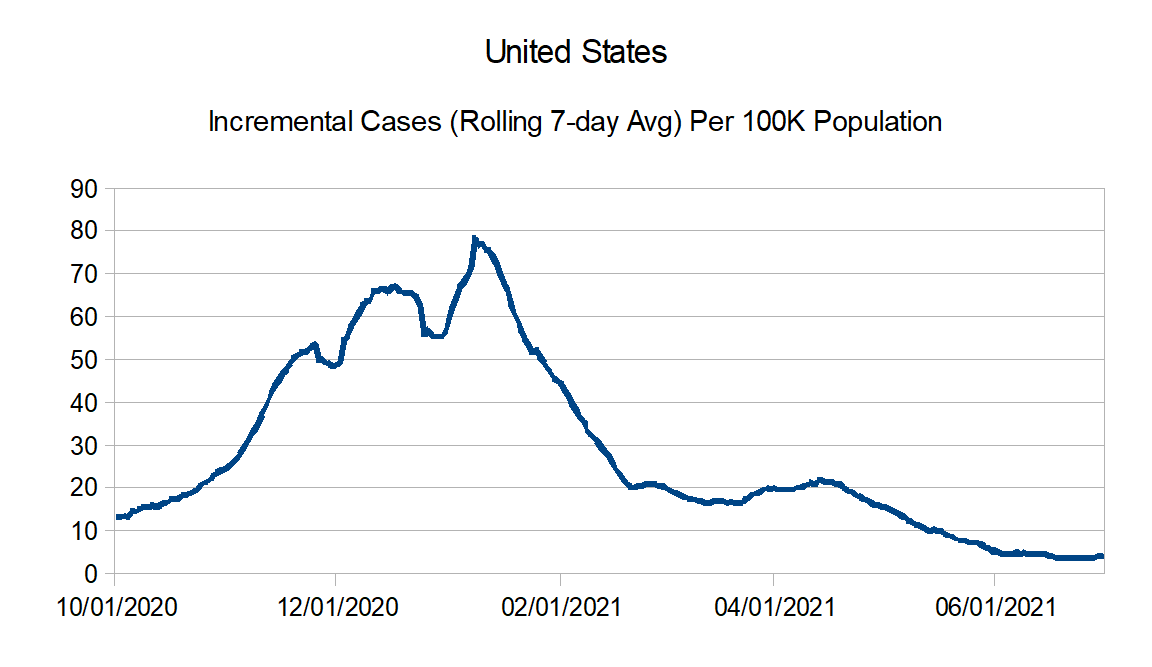
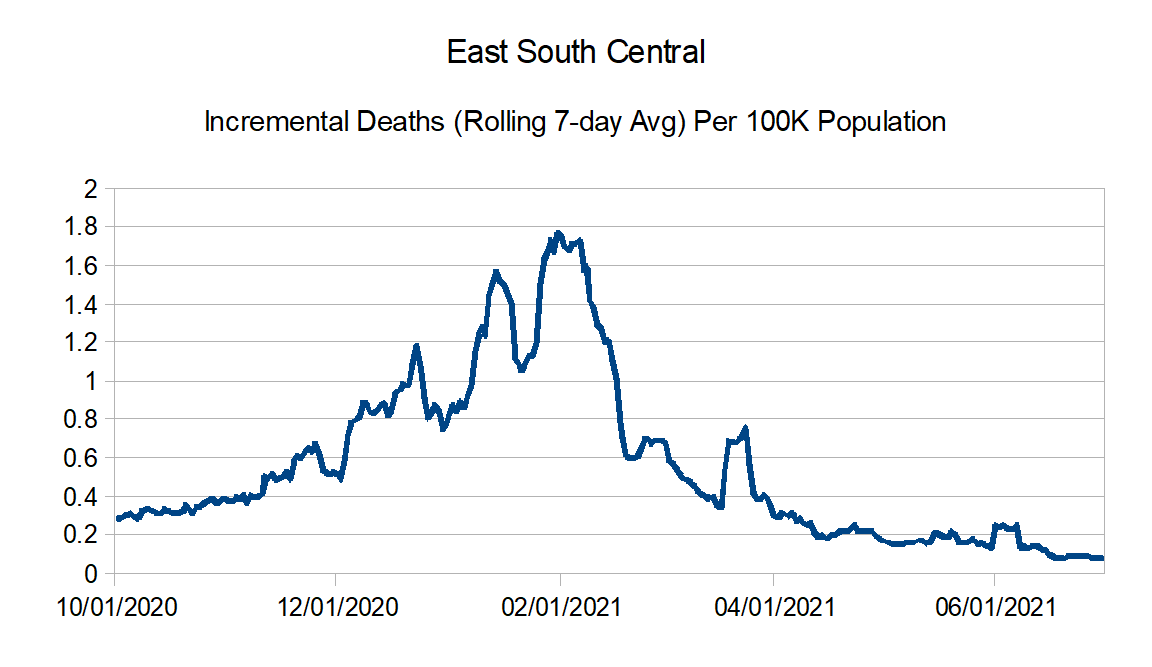
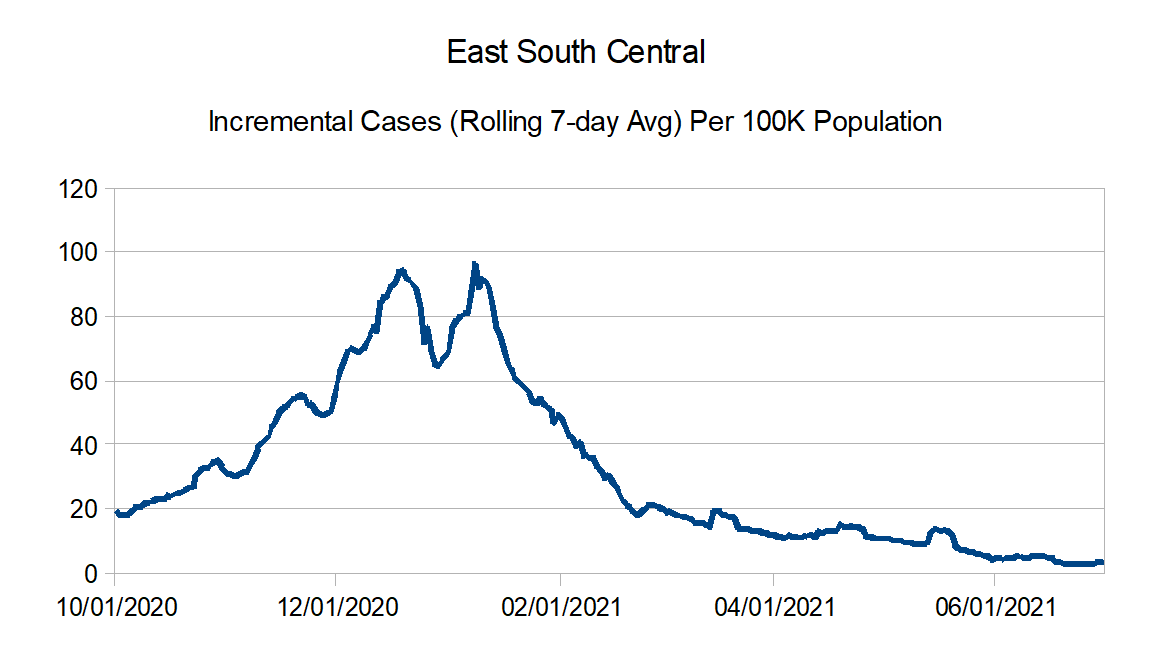
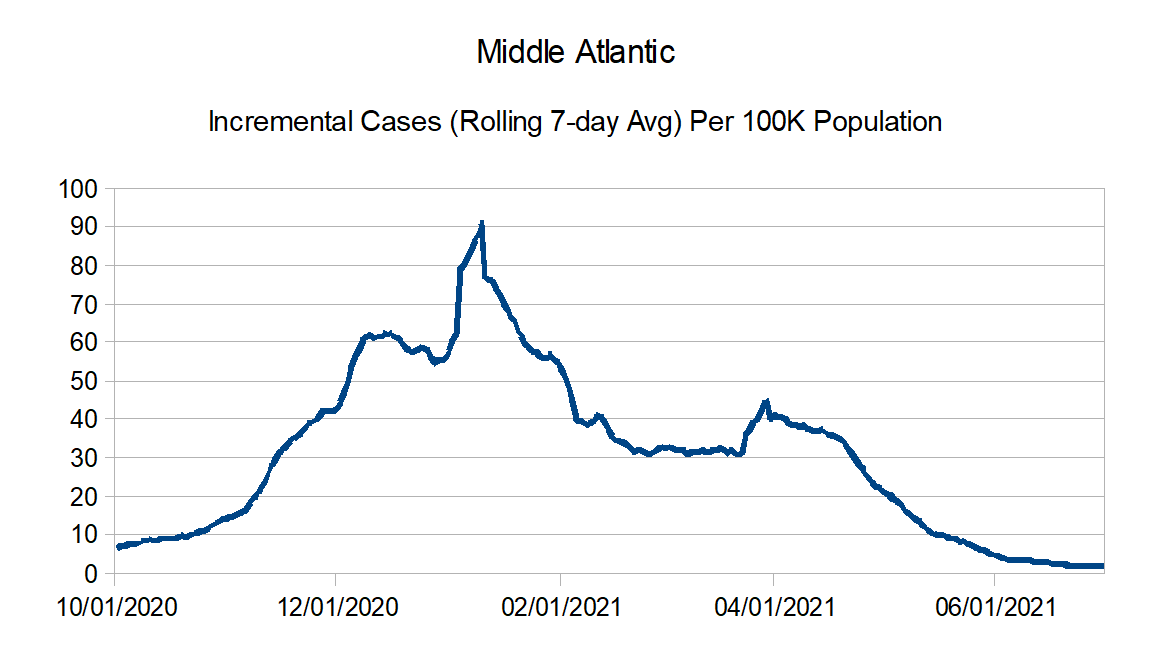
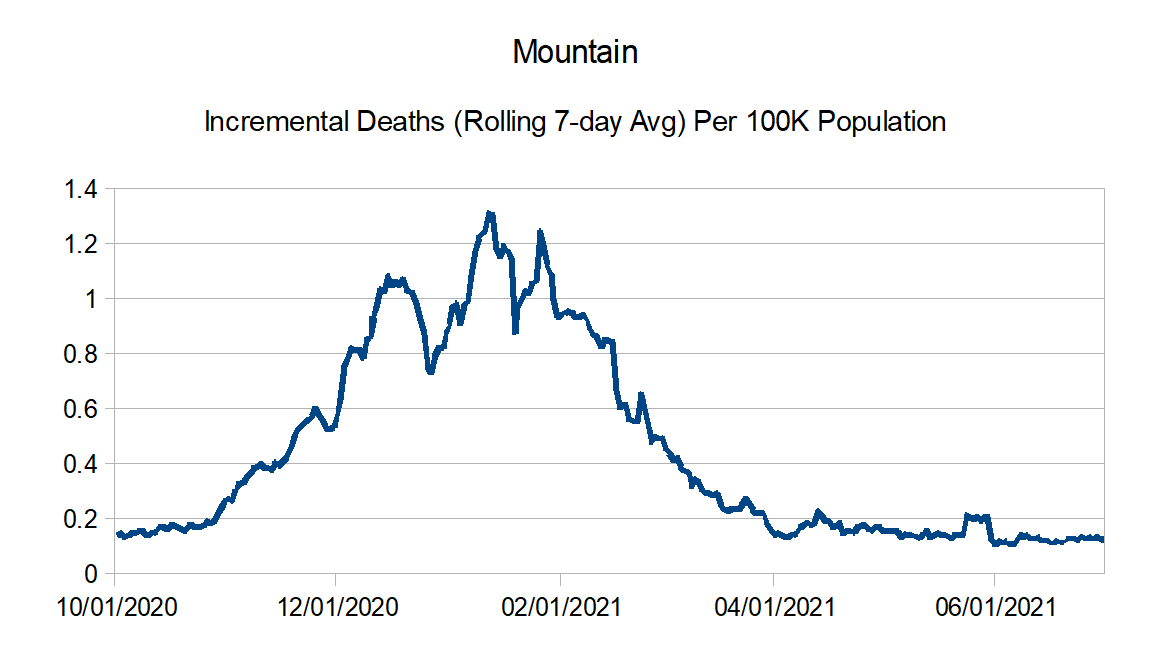
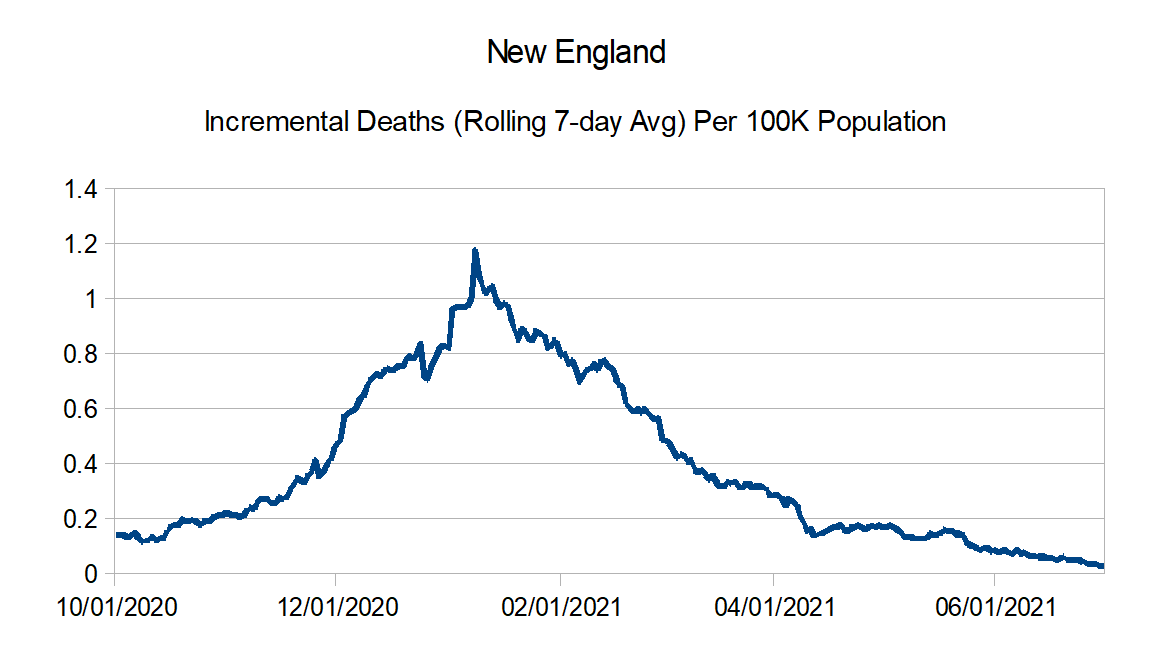
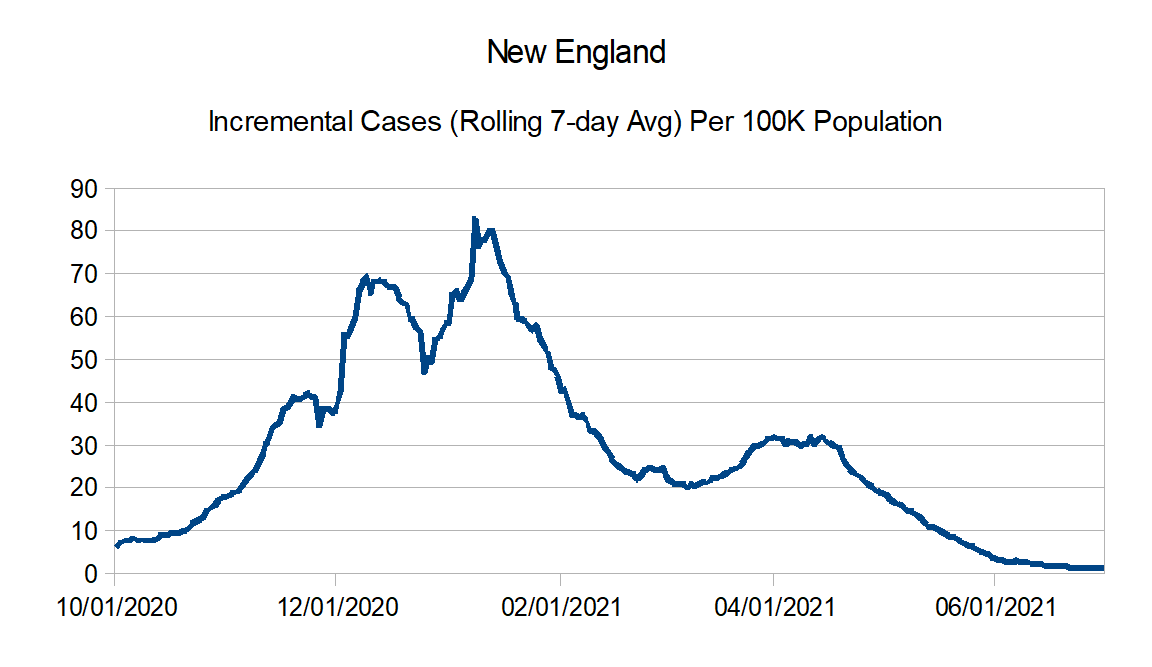
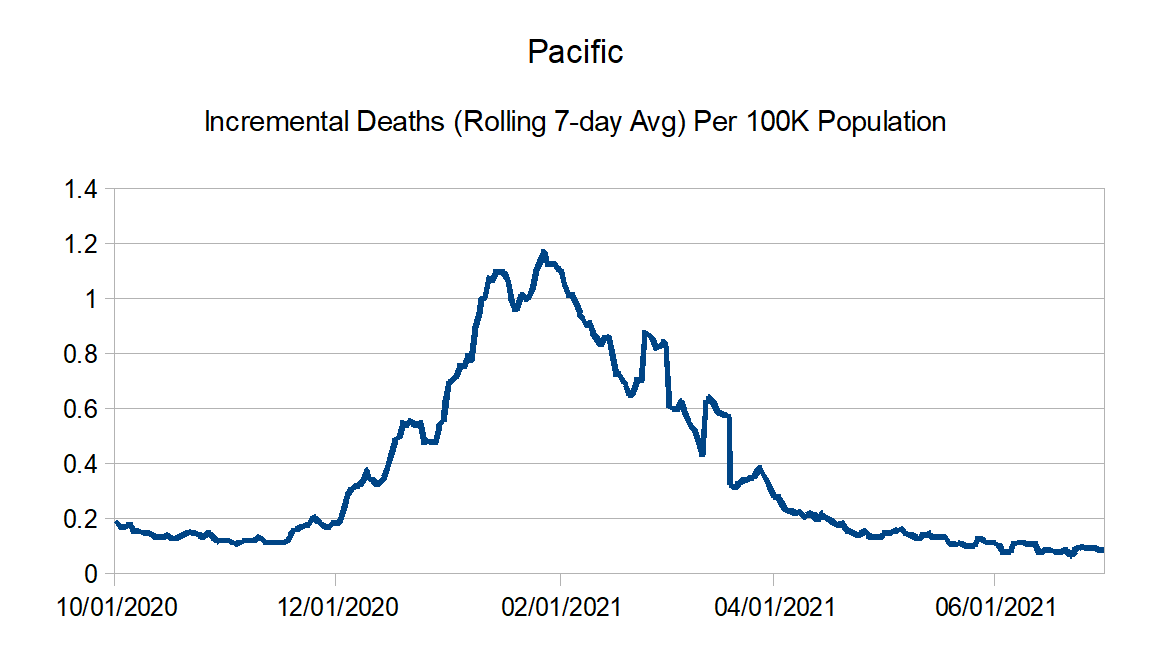
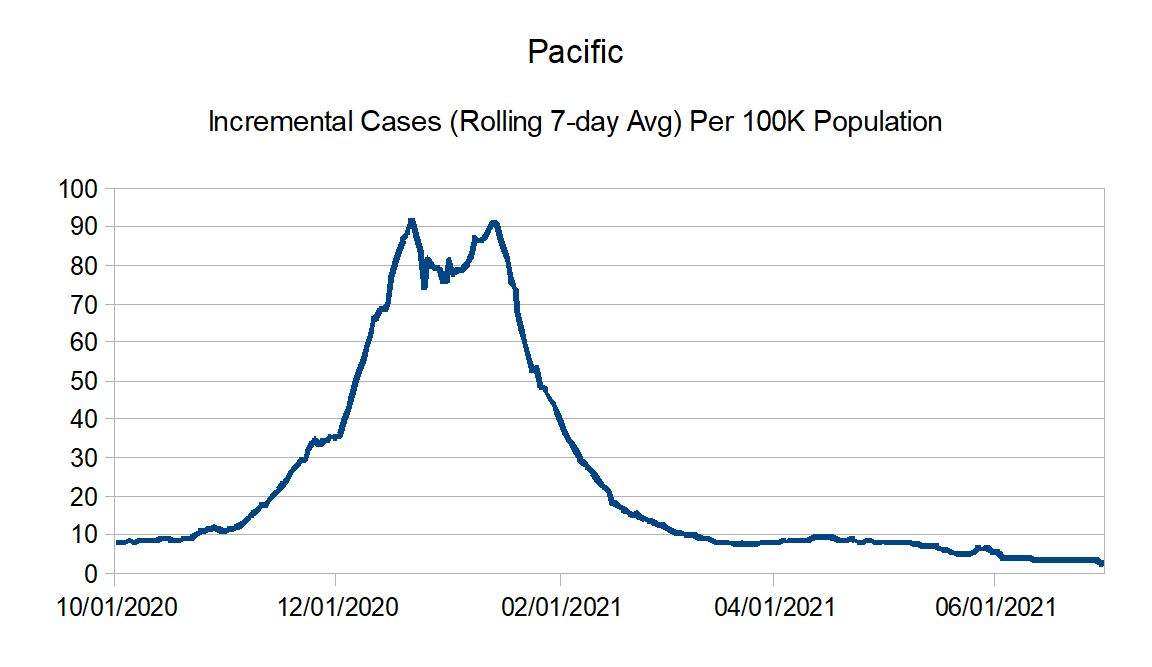
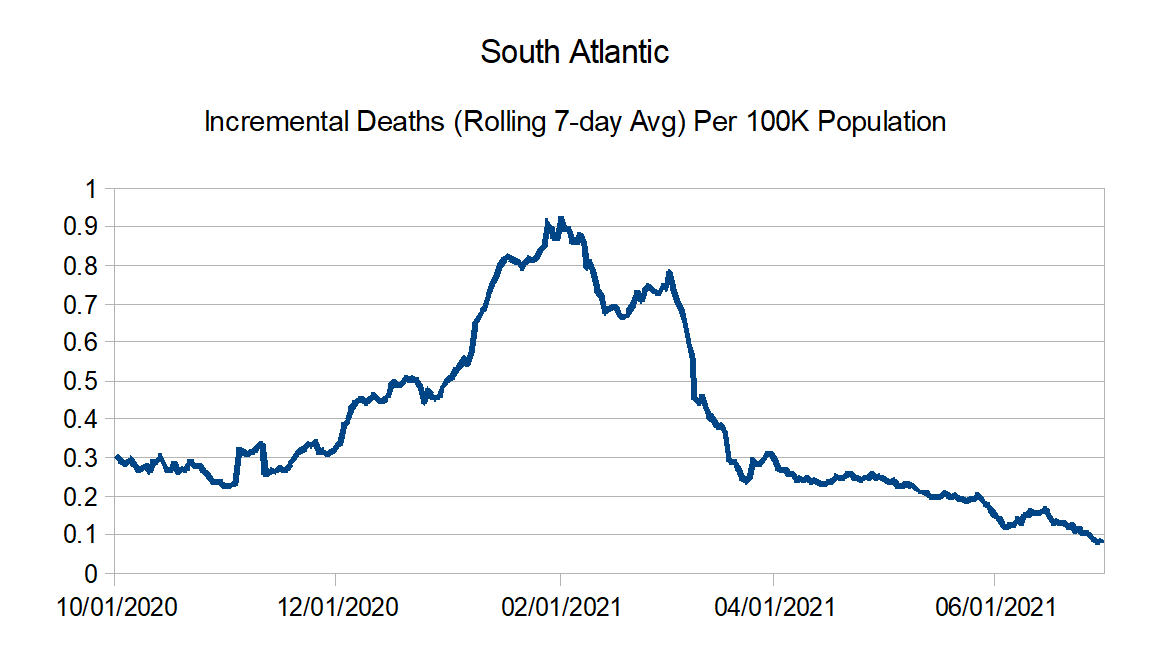
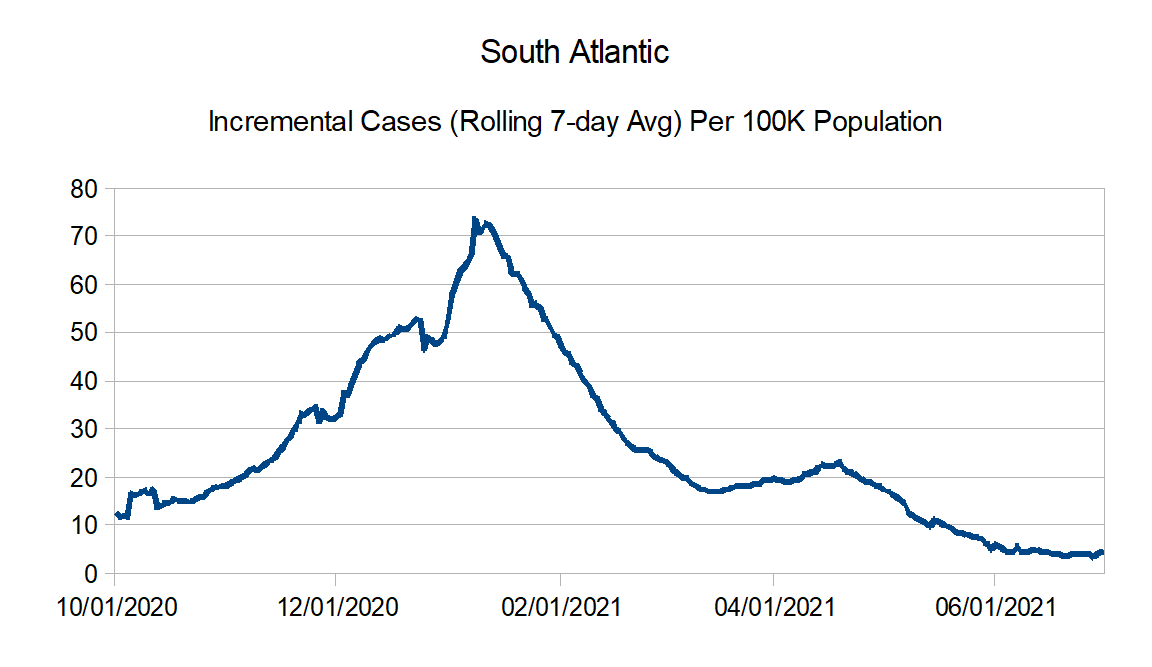
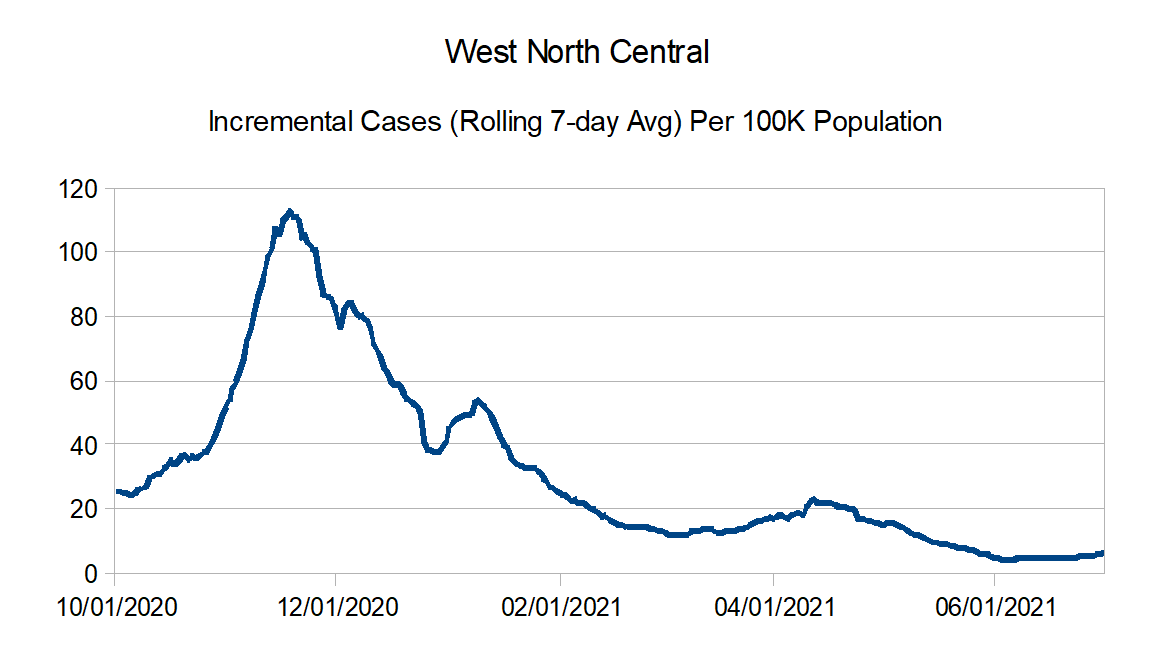
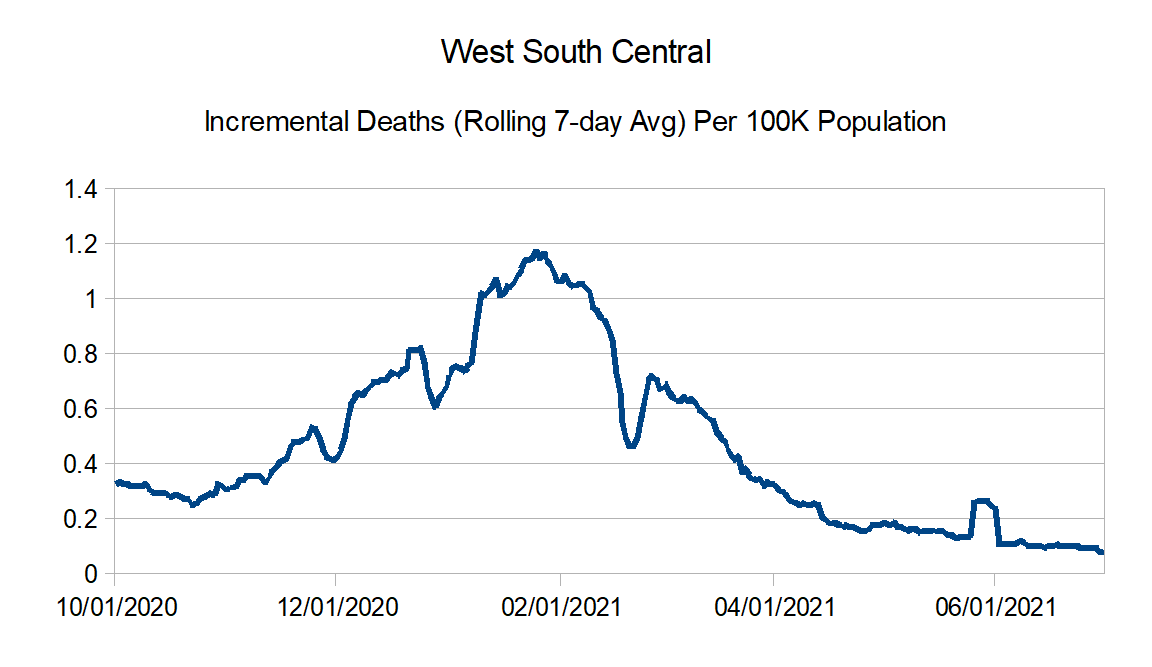
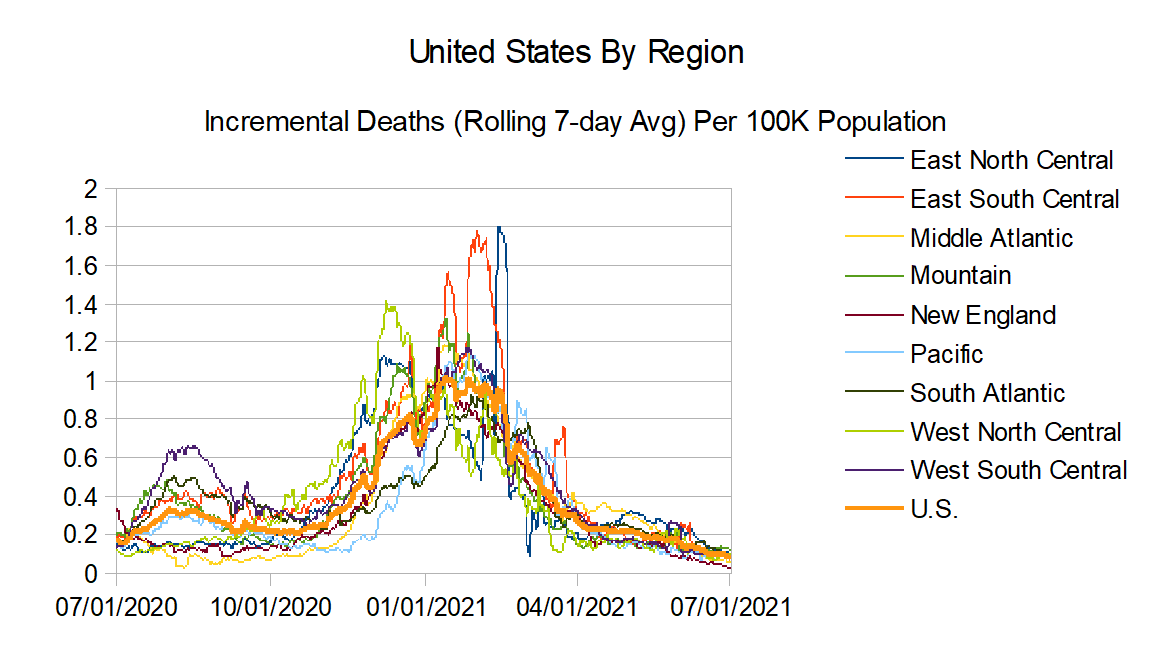
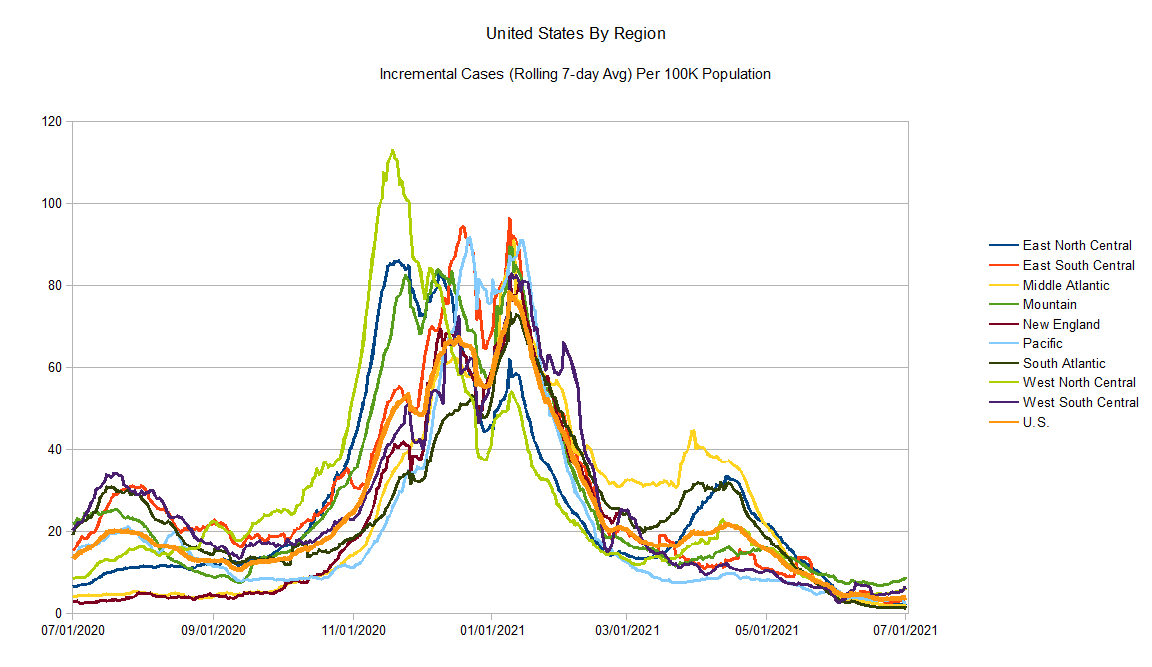
Looks like over the last month reported cases have continued to fall, though the decreases may be stalling out (could be the result of the Delta variant?). Reported deaths have also continued to fall to pretty low levels. The vaccines are working, and I believe will continue to get better results if we can get more people vaccinate (to that end, I think we need to be looking for solutions to make vaccination as easy as possible…not sure just encouragement is going to get the job done).
Data Source – New York Times github
Data Info – New York Times data info
Regions:
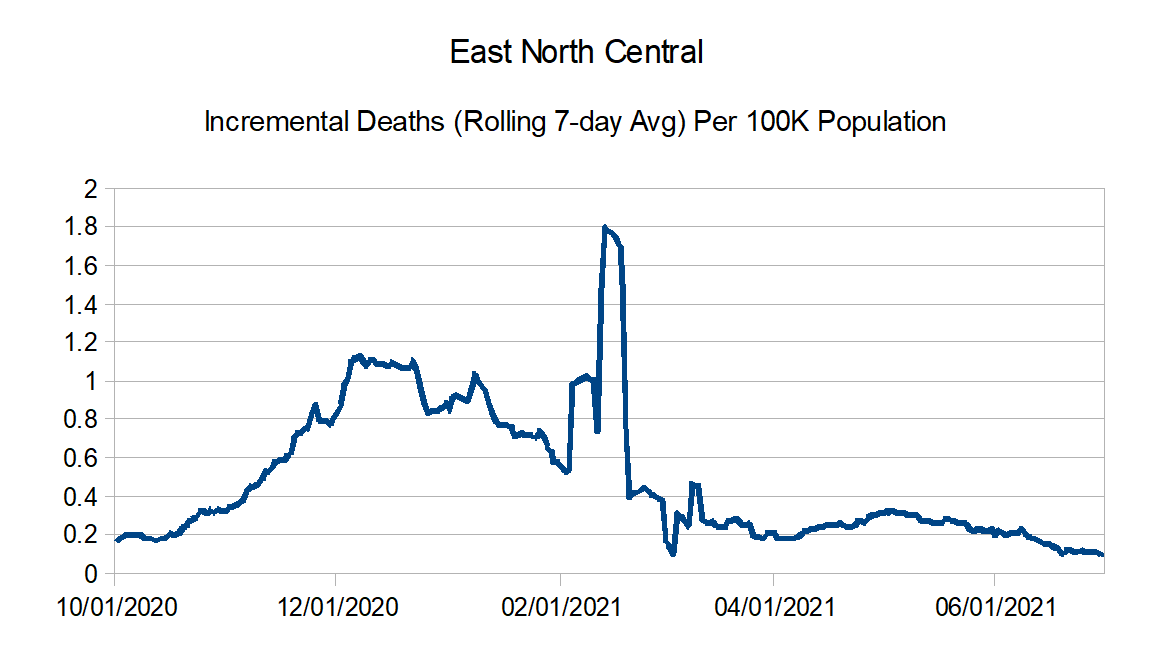
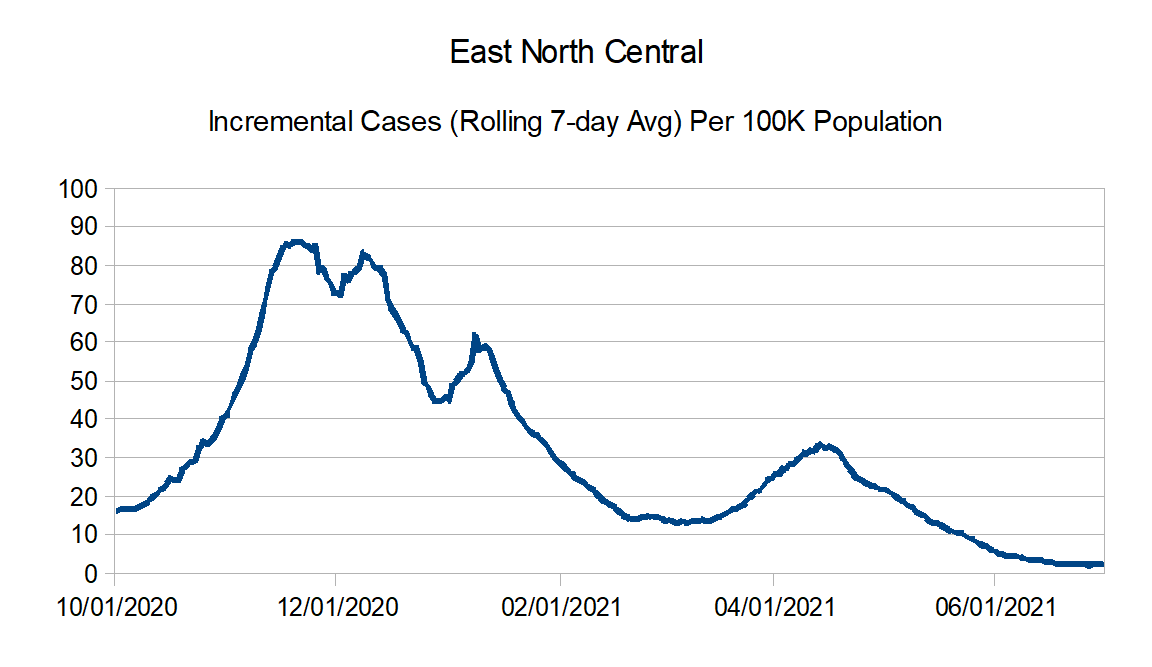
East North Central: Illinois, Indiana, Michigan, Ohio, and Wisconsin
East South Central: Alabama, Kentucky, Mississippi, and Tennessee
Middle Atlantic: Delaware, New Jersey, New York, and Pennsylvania
Mountain: Arizona, Colorado, Idaho, Montana, Nevada, New Mexico, Utah, and Wyoming
New England: Connecticut, Maine, Massachusetts, New Hampshire, Rhode Island, and Vermont
Pacific: Alaska, California, Hawaii, Oregon, and Washington
South Atlantic: Florida, Georgia, Maryland, North Carolina, South Carolina, Virginia, West Virginia, District of Columbia, Puerto Rico, Northern Mariana Islands, and Virgin Islands
West North Central: Iowa, Kansas, Minnesota, Missouri, Nebraska, North Dakota, and South Dakota
West South Central: Arkansas, Louisiana, Oklahoma, and Texas
United States Graphs:
Region Charts:


And finally here are the region comparison charts:
Happy Independence Day everyone. See ya in a month or so.
