Before I show the updated graphs, a couple of notes. First, even with all the news surrounding the Omicron variant, Delta is certainly still the dominant strain in the United States. Second, it is too early to tell what the impacts of Omicron will be. It almost certainly is more infectious. But the relative virulence is not yet known. It does seem while the vaccines may not be as effective in preventing absolute infection, it still provides solid protection against severe disease.
Data Source – New York Times github
Data Info – New York Times data info
Regions:
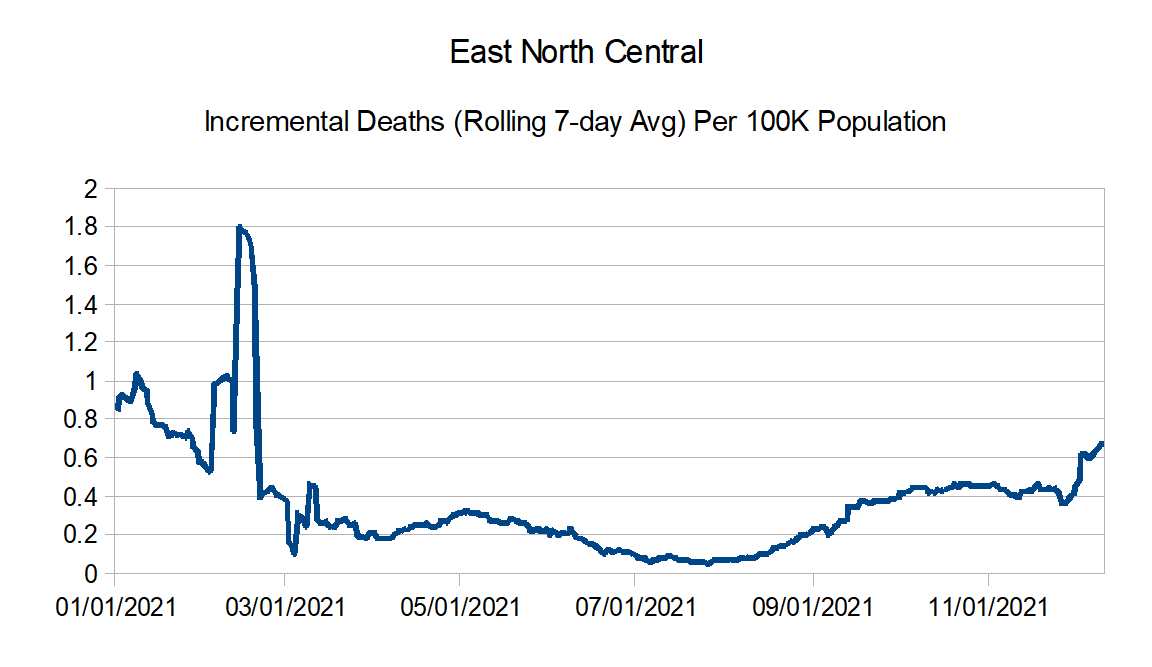
East North Central: Illinois, Indiana, Michigan, Ohio, and Wisconsin
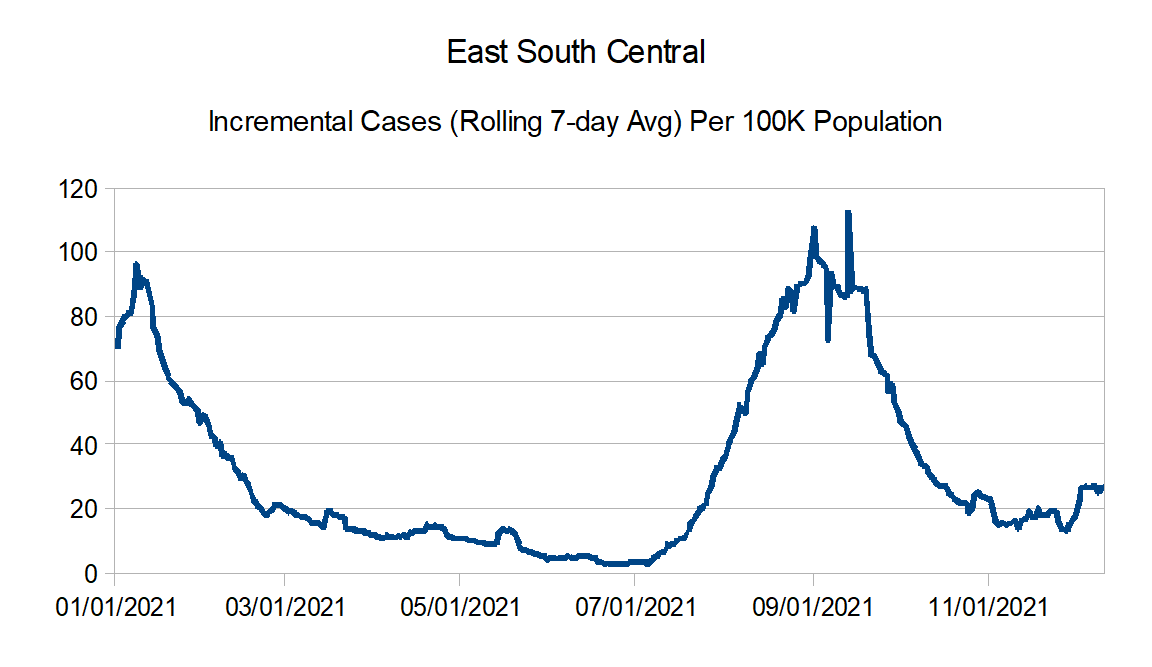
East South Central: Alabama, Kentucky, Mississippi, and Tennessee
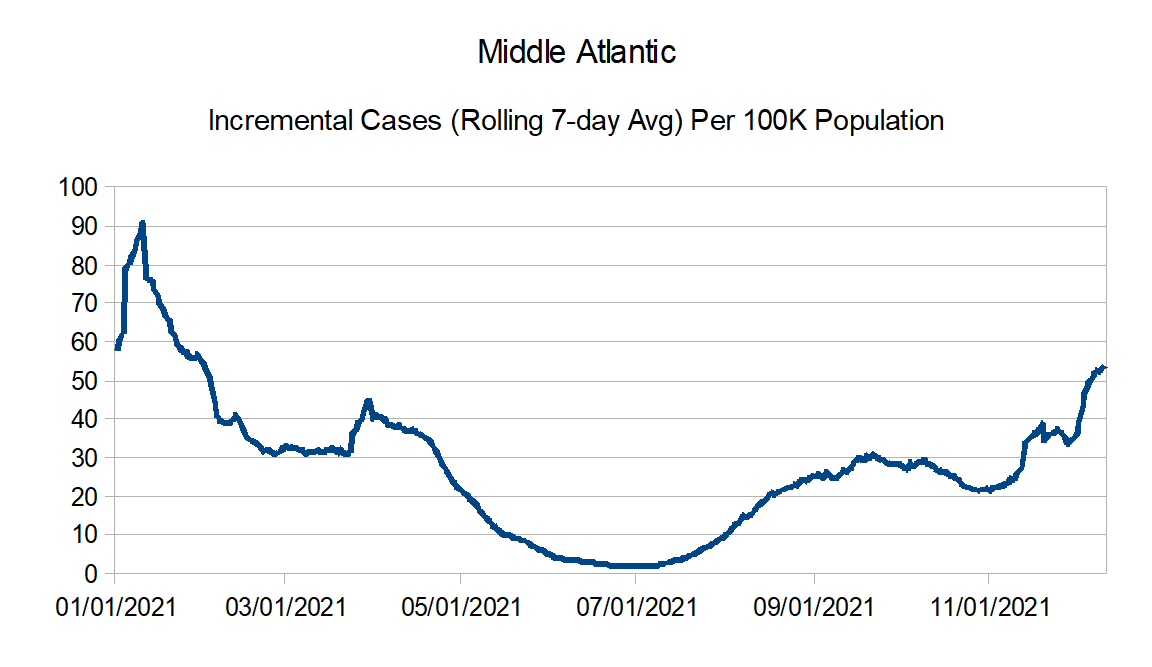
Middle Atlantic: Delaware, New Jersey, New York, and Pennsylvania
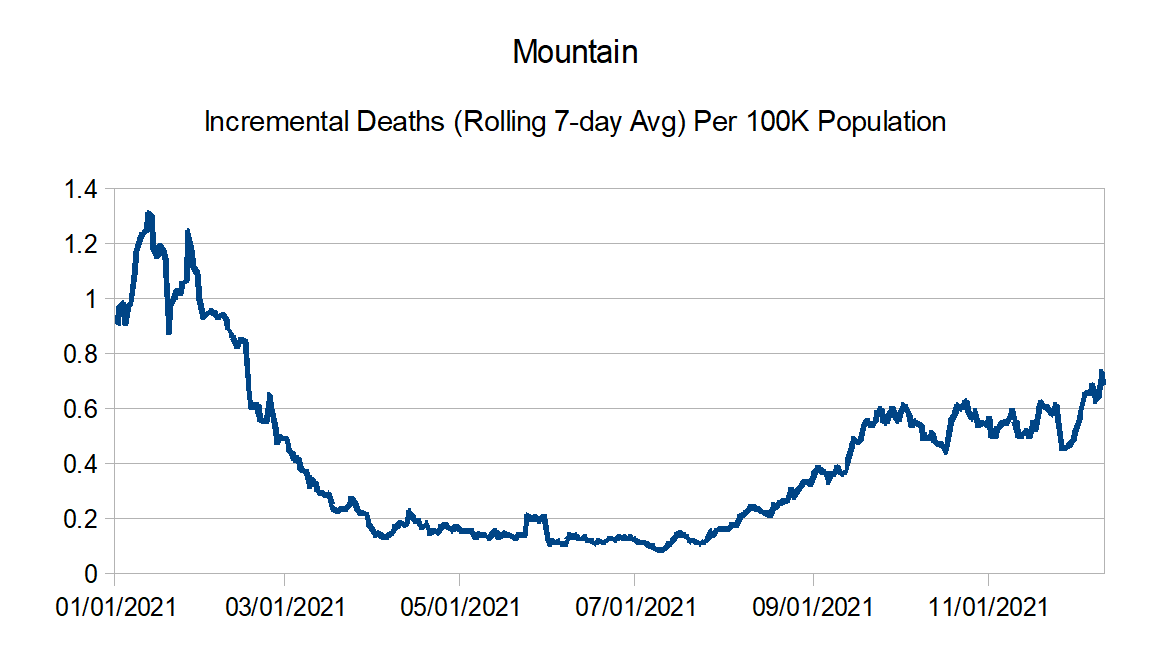
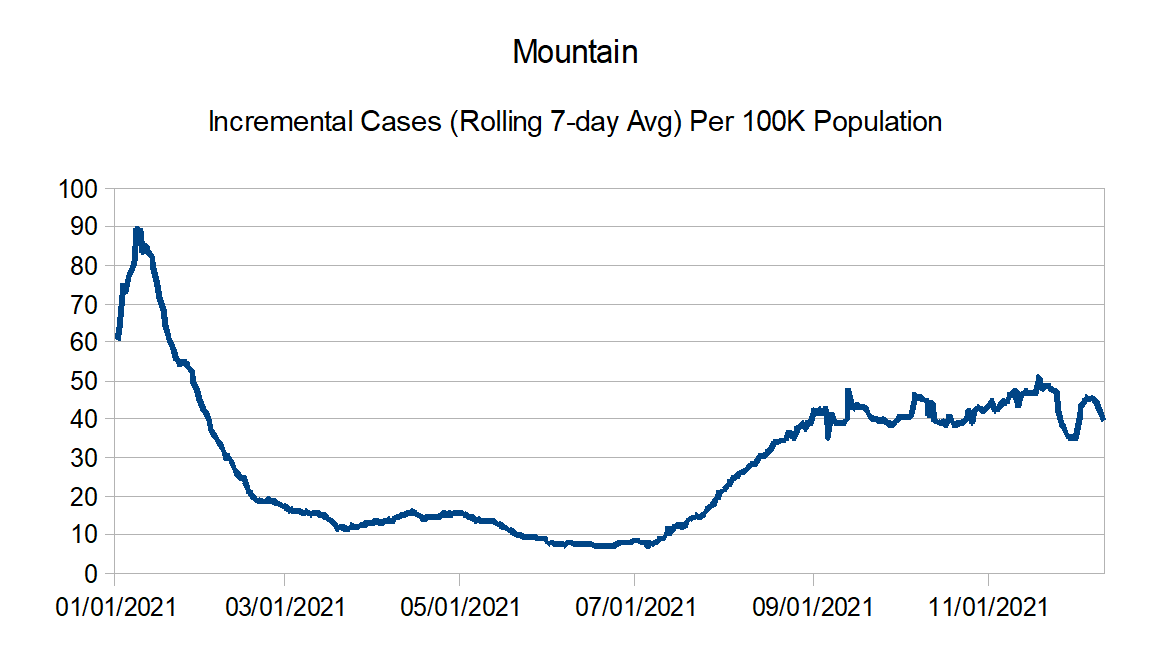
Mountain: Arizona, Colorado, Idaho, Montana, Nevada, New Mexico, Utah, and Wyoming
New England: Connecticut, Maine, Massachusetts, New Hampshire, Rhode Island, and Vermont
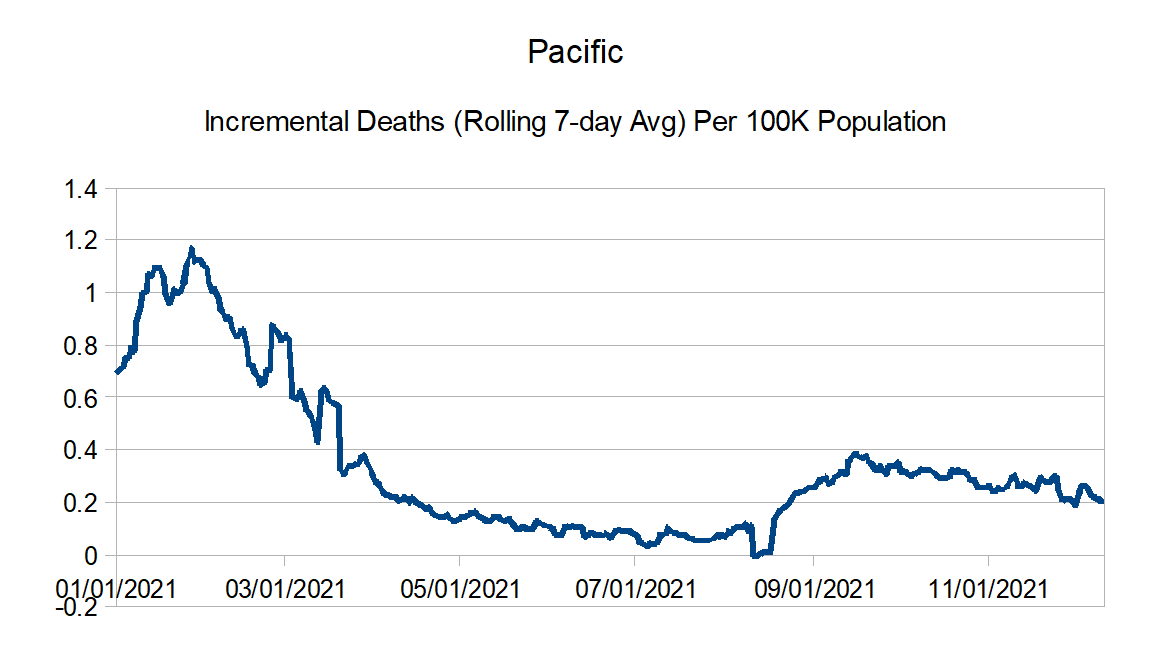
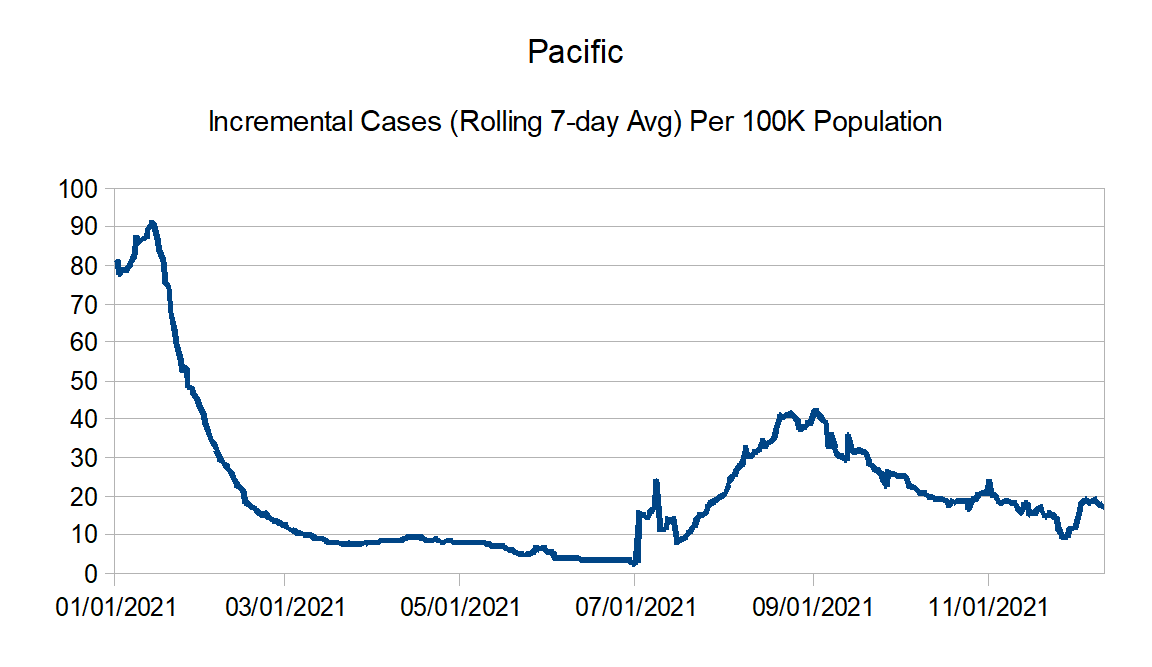
Pacific: Alaska, California, Hawaii, Oregon, and Washington
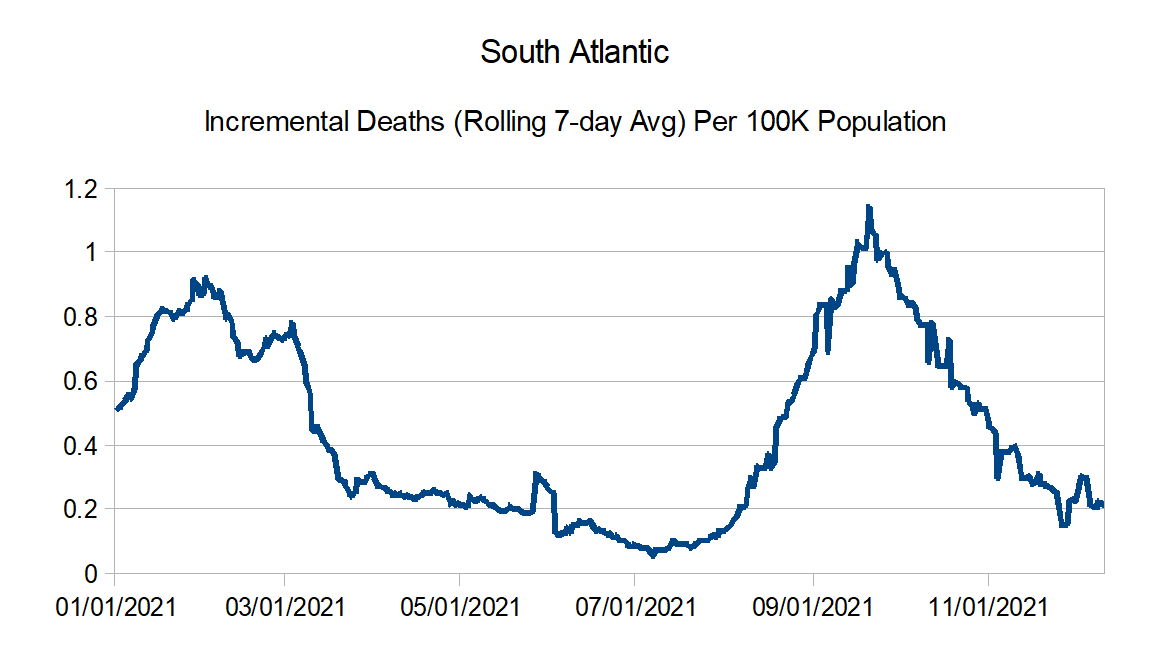
South Atlantic: Florida, Georgia, Maryland, North Carolina, South Carolina, Virginia, West Virginia, District of Columbia, Puerto Rico, Northern Mariana Islands, and Virgin Islands
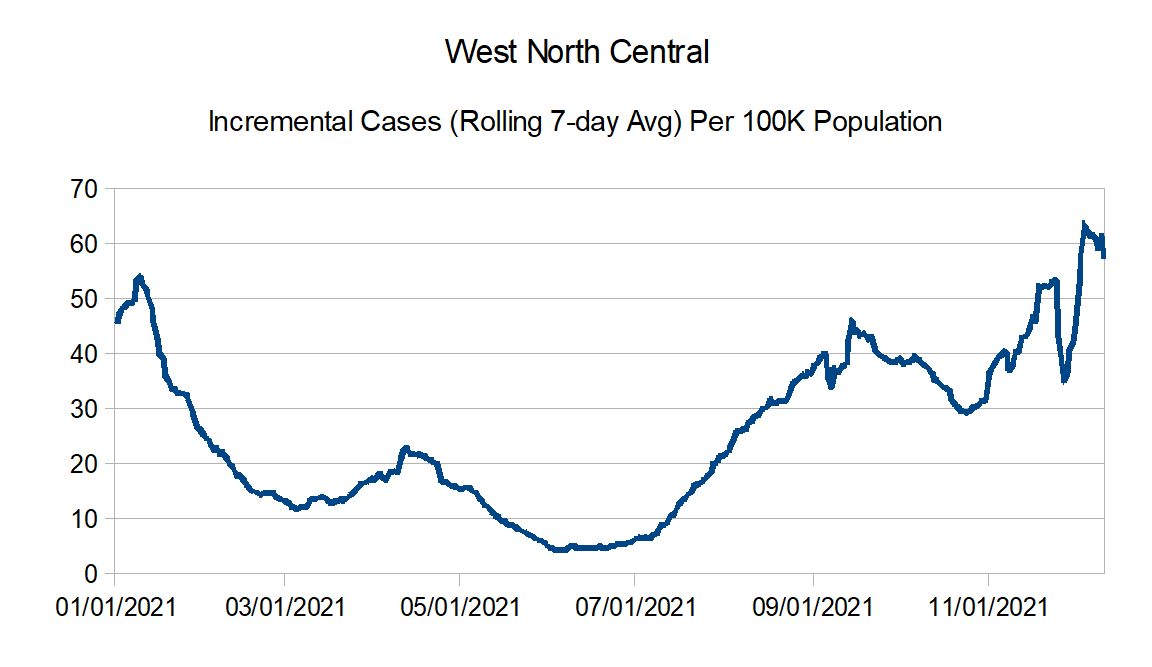
West North Central: Iowa, Kansas, Minnesota, Missouri, Nebraska, North Dakota, and South Dakota
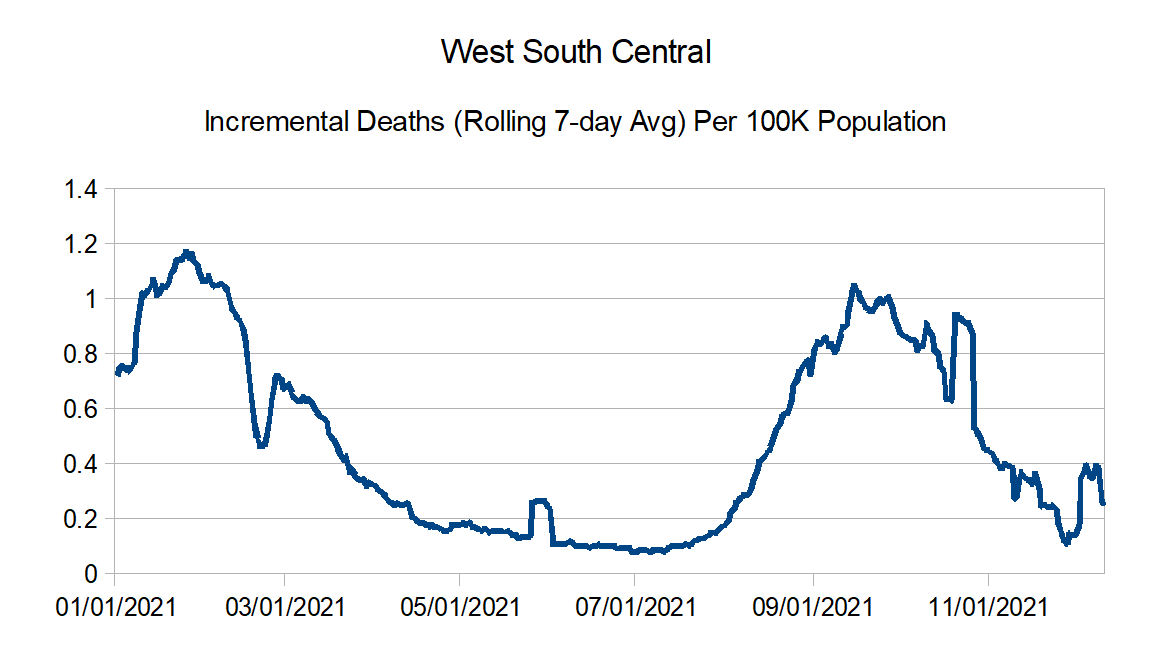
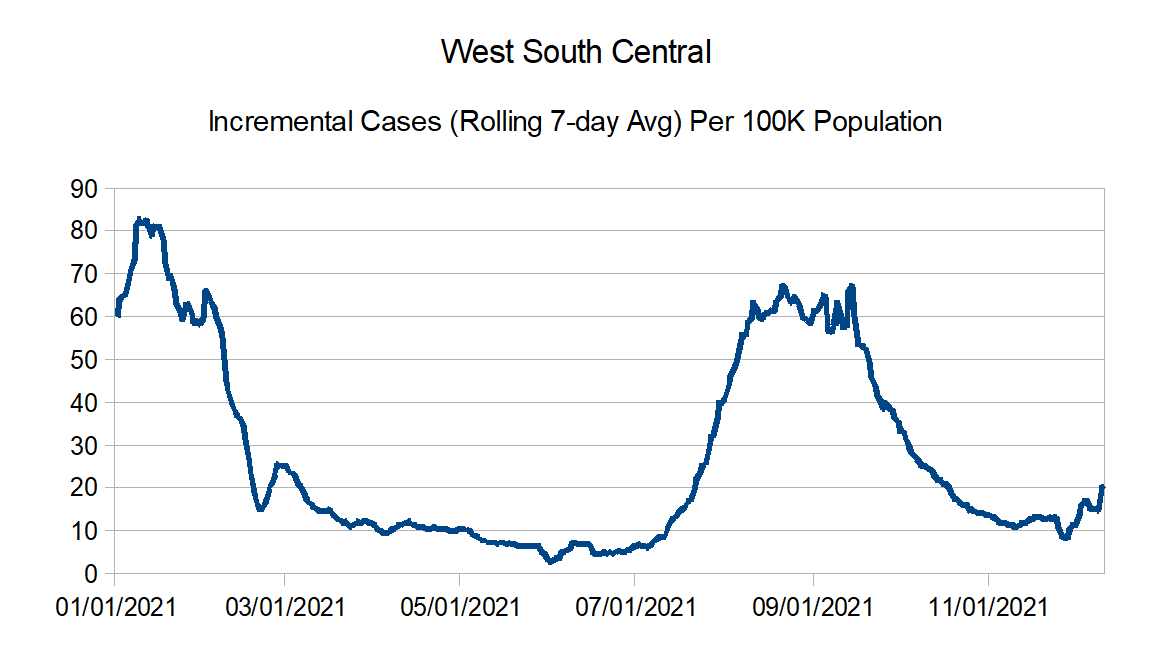
West South Central: Arkansas, Louisiana, Oklahoma, and Texas
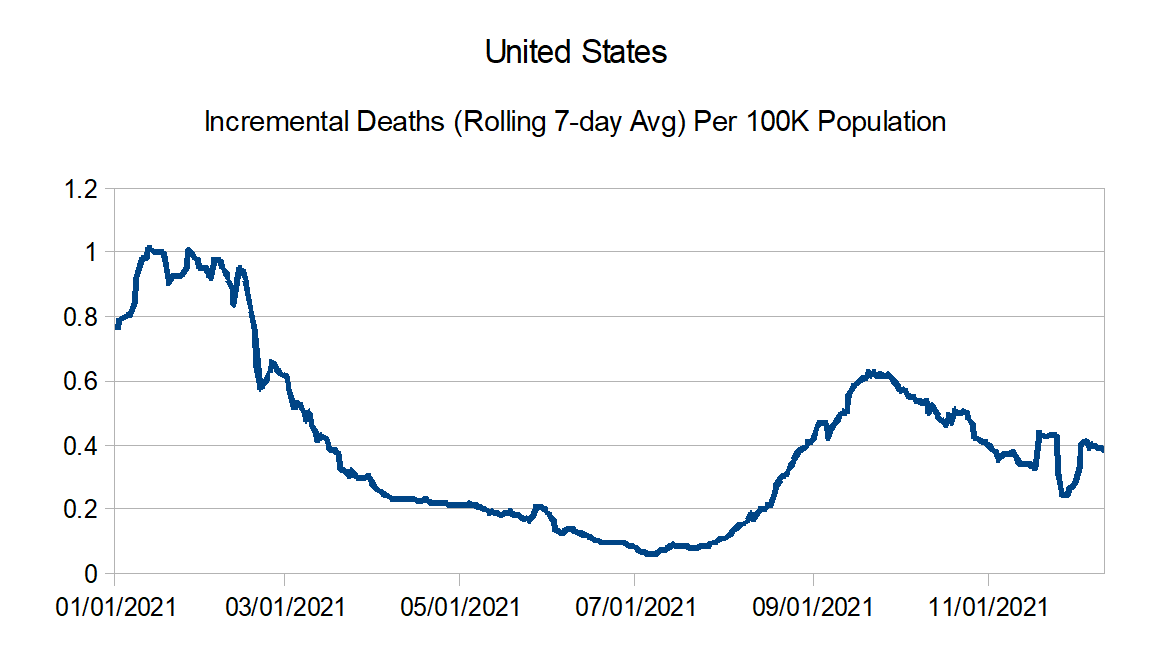
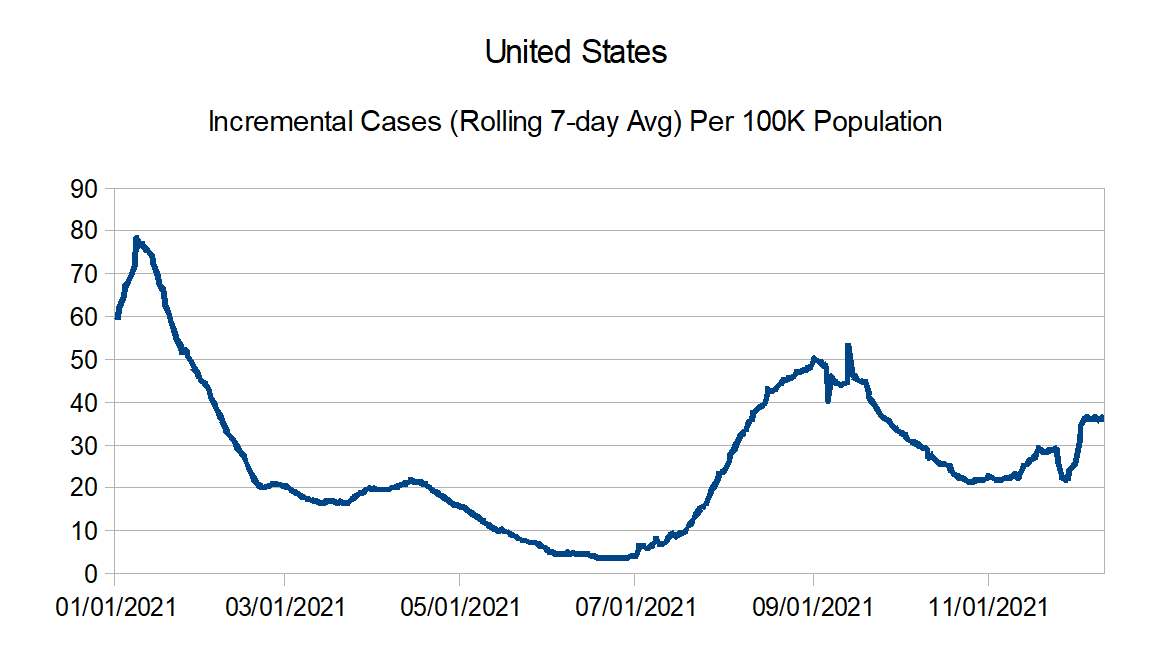
Here are the countrywide charts:
Regional charts:


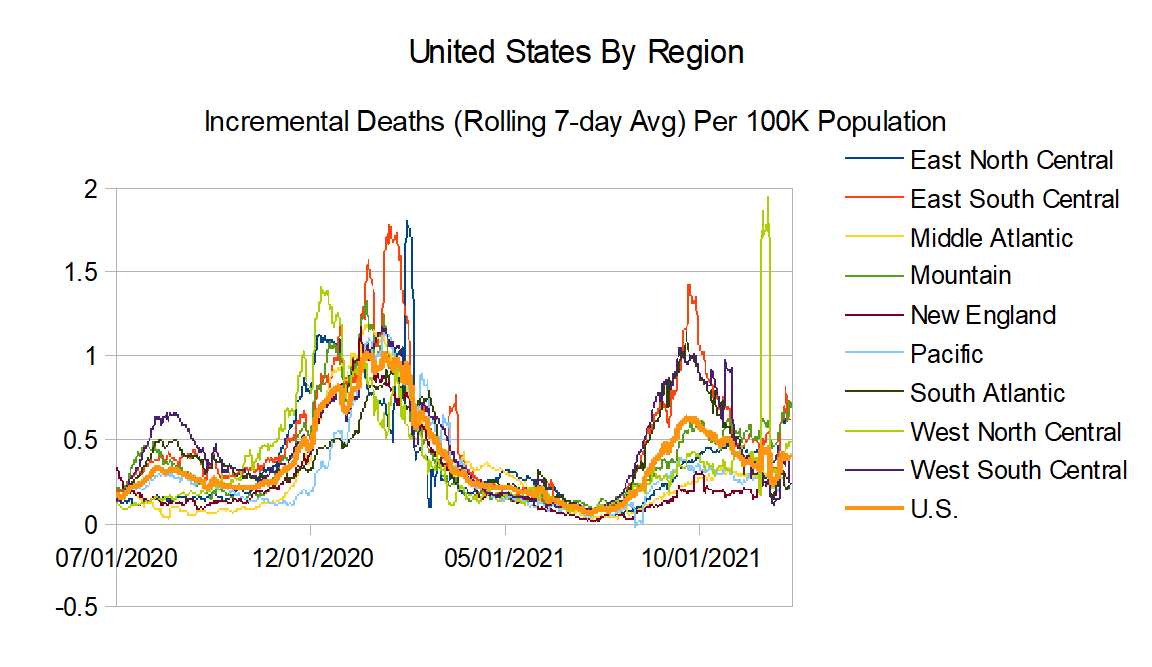
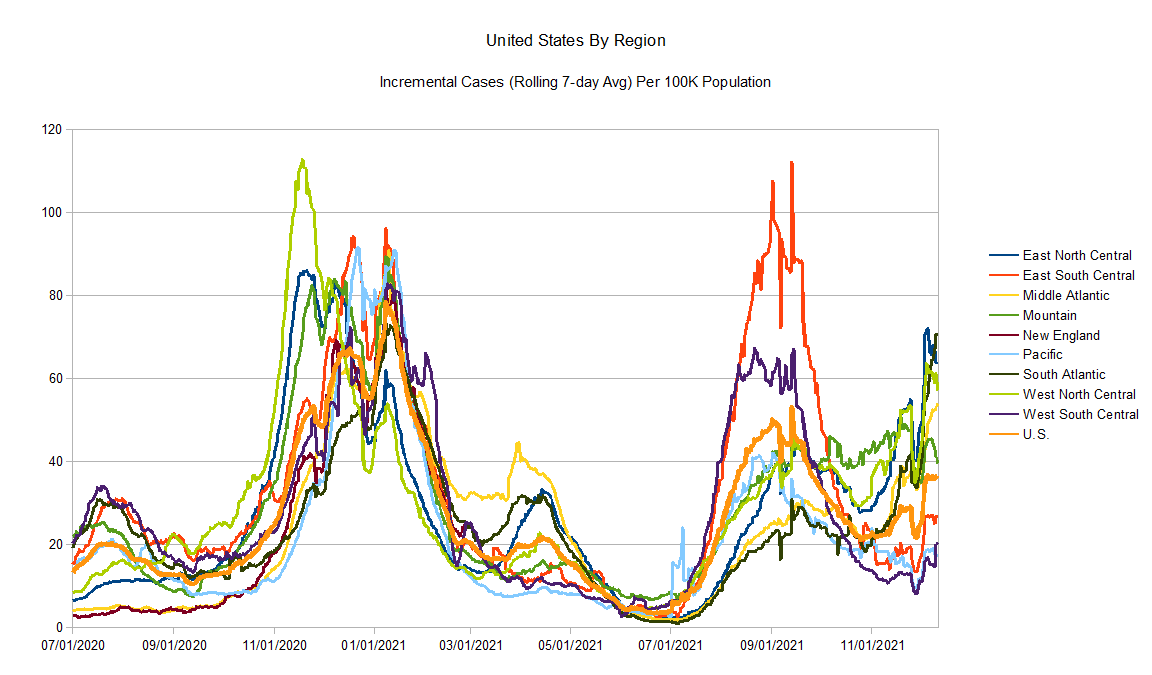
And finally the regional comparison charts:
I am coming up against my busy season at work, so it may be couple of months before I get a chance to update these again.
